IT Performance analysis is always a comparison task – usually between at least 2 states – an estimated, or precalculated or guesses, or before or somewhere else experienced or simply expcted “good” state – and the experience of a bad state.
comparisons can cover a multitude of scenarios like
- yesterday good – today bad
- my “guessed and understanding of “should be” vers. experienced bad
- location A vers. location B
- Application A vers. App B
- user A vers. user B
one of the most reliable ways to understand performance is analysis of packet data.
It is like a blood test – compared to ask the patient or measuring temperature.
Traces cannot lie – because they just provide measured and non-interpreted, unchanged data.
in this scenario is an approach described to use pcap data from 2 sides to easy and fast troubleshooting Performance issues of IT -services
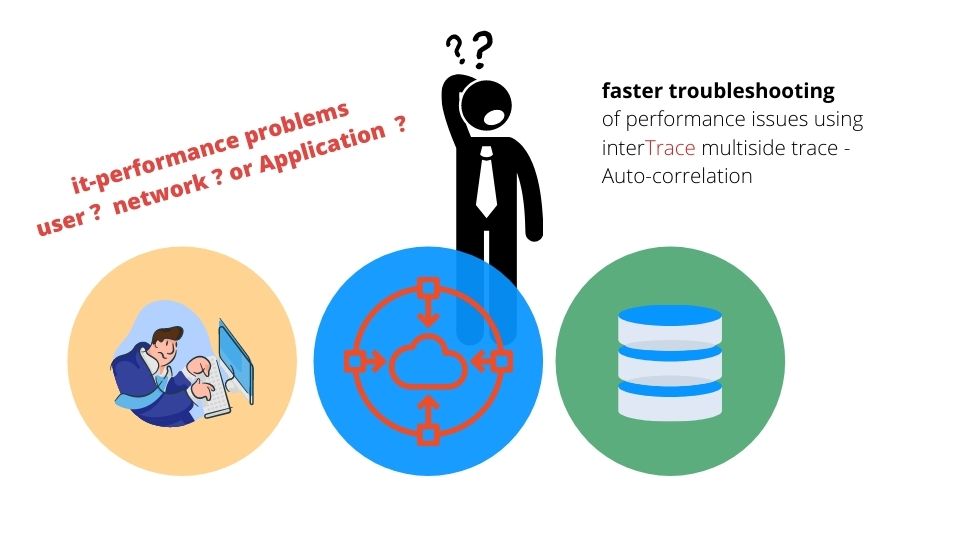
In each IT environment at least 3 areas are responsible for performance:
- The client Side
- The network
- The application/server side (which can of course be very complex)
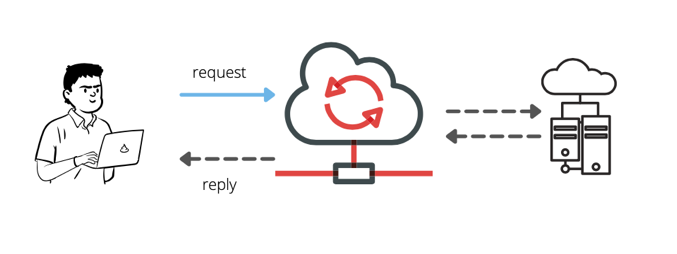
For a client the time between request and reply determines the external performance. ngs.
Performance issues
A client establishes a session to a server – and all data of this session should be in sync, like the number of sent client packets = number off received server-side packets
- Under optimal conditions – network time would not change – and performance is predictable.
- Under “normal” conditions – network performance does change – and service performance changes.
Latency can rise – by delays on components, by rerouting – from Berlin to Munich via NYC – packets are not received and acked – so retransmissions triggerd by sequencing or timeout may occur.
And the service responsetime depends on server-resources, application design, architecture, backend and a high variety on components.
If performance issues occur
Which side is causing the performance issues experienced by clients
- If clients can rule out local error – it should be caused by network or server
- If server receives a request and processes it instantly and fast – the cause is at client – or network
- if the network can guaranty fast and error free end2end throughput – the cause must be client or server
This happens often – that all sides declare their innocence based on their available information – but the problems persist!
To resolve issues – people need to understand fast and precise – which side is responsible This is not blaming game – if it is done with the right methods.
Method of analysis using packet capture
One of most precise methods for such situation is packet capture & analytics.
It is like a blood test – compared to ask the patient or measuring temperature.
Traces cannot lie – because they just provide measured and non-interpreted, unchanged data.
Typical questions to clarify
- A client sends a request – was it received at the server?
- was it correct received?
- What is the delay between send and receive?
- A client sends request retransmission – why was retransmitted?
- was first request NOT received by server ? did he replied and reply was not received at client ?
- where both request received at the sever ?
- If packet loss occurs – where does it happen ?
- Are there any differences between send – and receive order?
- client request – received out-of-order ?
- Is TTL constant at the receiver side?
These are very essential questions – and answers of those can point to the cause of delay
But – using single trace file tools – this sounds like a huge manual work – comparing packets by packets in wireshark.
.
Automization by multiside traces / Auto-Correlation (MTAC)
… a feature developed for SharkMon – our solution for analyszing large number of pcap files with wireshark metrics to provide an ongoing monitoring.
SharkMon enables users to define packet analysis scenarios for 1000s of trace files – providing a constant monitoring – and to correlate and compare both sides based on free definable metrics of packet content by using same variety and syntax as wireshark.
If traces/pcap files of sender (client-PC) and receiver (server-side tcpdump, datacenter capture probe) exist for same time – they can be synchronized and issues of data integrity, packet loss, timing, route changes, application performance etc. easily identified.
Process
First check: measure service time to identify issues.
This should be done on client side to understand clear the difference: how fast is the reply received on the client – and on the providing site/server sametime.
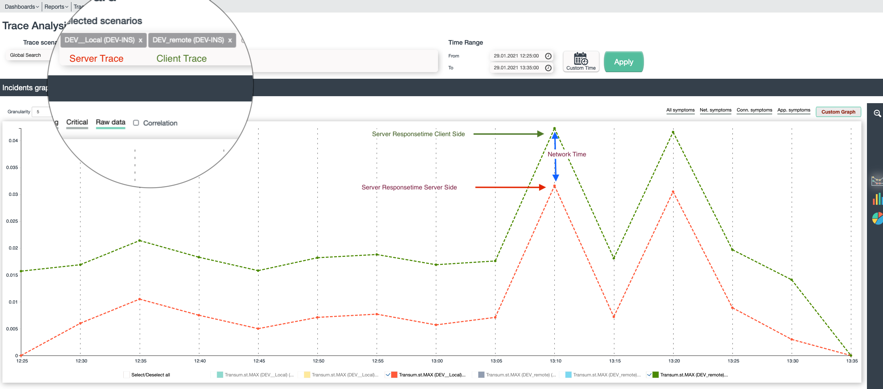
The picture below shows the results from 2 side locations :
- Client side – the green line
- Server-side – the red line
The gap between both lines is the network time
You can identify a spike on both lines at 1:10pm, which makes clear – that this is a server / backend issue – because the responsetime measured directly on the server via tcpdump shows the same outage – this is local server performance.
But people still want to understand the variance of network effects here.
The following picture shows the variation of network performance on 2 sides:
- TTL – for measuring the number of routing hops end2end, a variation would point to rerouting and latency
- iRTT – for the average latency based on 3way handshake
- RTO – the time for retransmission effects
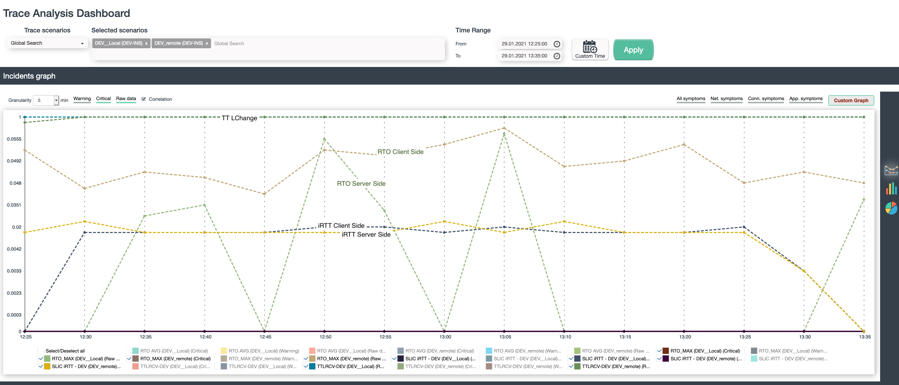
The results here are clear
- TTL did not change – the route between both side is constant
- iRTT is on both side constant – no much variation in latency
- iRTO is at client side constant and higher than on server side – the experienced networking issue will be not on the server-side.
Summary
Using 2-side trace-correlation – client / Service effects are identified fast – and precise.
Finger-pointing is clearly avoided – Downtime reduced.
It can show clear if the incident was caused on the transfer network or at the server-side infrastructure.
In case of network issues – it can clear identify the real important parameters.
SharkMon by interview network solutions
SharkMon can collect packet data from multiple locations and entities:
- direct on the service using tcpdump/tshark
- large capture probesy via API
- manually upload of tracefiles
User can import 1000ds of tracefiles for a providing a constant monitoring history.
Tracefiles are organized in scenarios which can be easily correlated – such allowing analysis scenarios like
- Client vers. Server
- location A ves. other location B
- User A vers. User B
- Application A vers. Application B
- Leaving country A very. entering country B (geo-political scenario)
It can use any metric which can be found in wireshark for monitoring – allowing deepest monitoring ability in the industry.
This allows usage in networking environments as
- WAN / Network
- datacenter
- Cloud – IaaS/PaaS
- WLAN
- VPN
- Industry / industrial ethernet
- User endpoints
